Monocle3 Analysis
Preface
TIP
Monocle3 is an advanced tool in the field of single-cell trajectory analysis. It has undergone significant innovations based on its predecessor, enabling efficient processing of ultra-large datasets with millions of cells and better resolution of complex biological processes involving multiple separate lineages.
In single-cell research, the cells we capture are often different "snapshots" from a continuous dynamic process. The core task of pseudotime analysis is to use algorithms to reorder these static snapshots based on their intrinsic transcriptomic similarity, thereby reconstructing the dynamic biological trajectories they have undergone, such as cell differentiation, disease progression, or drug response processes.
Core Functions of Monocle3
- Large-scale data processing: Capable of efficiently analyzing massive datasets with millions of cells.
- Complex trajectory construction: Excels at handling complex biological systems with multiple disconnected trajectories (Partitions).
- UMAP-based trajectory learning: Learns trajectories directly in low-dimensional spaces like UMAP, better preserving the global structure of cells.
- Gene dynamic analysis: Identifies gene sets that co-vary along trajectories or in specific modules, revealing core molecular mechanisms of regulatory processes.
This document aims to provide researchers with a detailed technical guide to Monocle3, covering its core principles, operation methods on the SeekSoul™ Online platform, result interpretation, practical cases, and frequently asked questions, helping you quickly master and apply this powerful analytical tool.
Monocle3 Theoretical Basis
Core Principles
Monocle3 shares the same core idea as Monocle2 but follows a completely different implementation path. It posits that: The dynamic process of cells can be described as one or more graph structures in a low-dimensional geometric space (such as a UMAP plot). By learning the principal graph of cells in this low-dimensional space, developmental trajectories can be reconstructed.
The trajectory inference in Monocle3 mainly consists of four steps:
Dimension Reduction: First, standard methods like PCA and UMAP are used to reduce the dimensionality of the data, projecting cells into a 2D or 3D space. This forms the foundation for all subsequent analyses.
Partitioning: Monocle3 automatically detects whether there are separate, disconnected cell clusters in the low-dimensional space and divides them into different "partitions." This allows Monocle3 to analyze multiple independent trajectories simultaneously.
Learning the Principal Graph: Within each partition, Monocle3 uses the SimplePPT algorithm to learn a principal graph that passes through the center of the cell cloud. The "skeleton" of this graph represents the main path of cell state transitions.
Cell Ordering and Root Node Specification: Users need to specify one or more "root nodes" on the graph as the starting points of trajectories based on biological prior knowledge. Subsequently, the algorithm calculates the shortest path distance from each cell to the nearest root node, which is defined as the pseudotime value of that cell.
Key Differences from Monocle2
| Feature | Monocle2 | Monocle3 |
|---|---|---|
| Core Algorithm | DDRTree | UMAP + SimplePPT |
| Data Scale | Suitable for tens of thousands of cells | Scalable to millions of cells |
| Root Node Specification | Can be automatically inferred but often requires manual correction | Must be manually specified |
| Trajectory Morphology | Usually a single, connected tree-like structure | Can contain multiple disconnected trajectories (partitions) |
| Dependencies | Independent workflow | Tightly integrates with Seurat/Scanpy preprocessing results |
TIP
The key difference between Monocle3 and Monocle2 is: Monocle2 attempts to directly learn a "tree" in high-dimensional space, while Monocle3 first "flattens" the data onto a UMAP plot and then "draws" trajectories on the plot. This makes Monocle3 faster and better at handling complex, disconnected trajectories.
SeekSoul™ Online Operation Guide
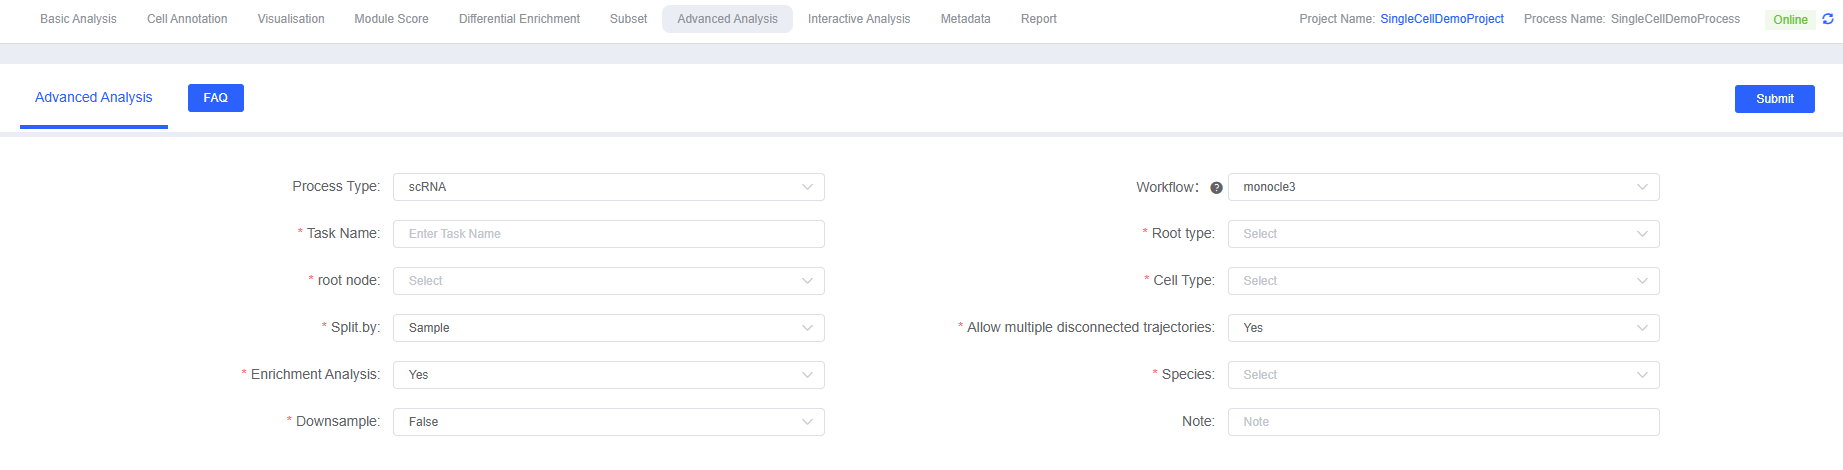
On the SeekSoul™ Online platform, the Monocle3 analysis workflow is designed to be intuitive and easy to use. You don't need to write code; you can complete the analysis through the parameter configuration interface.
Preparation Before Analysis
TIP
The success of Monocle3 analysis largely depends on the quality of input data and the rationality of biological questions. Before starting the analysis, please ensure:
- Data preprocessing is complete: Your single-cell data has undergone standard quality control, dimension reduction (PCA, UMAP), clustering, and cell type annotation.
- Appropriate cell subsets are selected: Pseudotime analysis should be performed on cell subsets with potential differentiation or transition relationships. It is meaningless to include biologically unrelated cells in the same analysis.
- Biological starting point is clear: This is the most critical step in Monocle3 analysis. You must clearly identify which cell population is the initial state of the process you are studying (such as stem cells, progenitor cells, naive T cells, etc.) based on known biological knowledge.
Parameter Details
The following table details the main parameters of the Monocle3 analysis module on the platform.
| Interface Parameters | Description |
|---|---|
| Task Name | Name for this analysis task, must start with an English letter, can include English letters, numbers, underscores, and Chinese characters. |
| Root type | Select the label corresponding to the cell type or cluster to be analyzed, for example, cell annotation group celltype. This parameter is used in conjunction with "Root Node" and "Cell Type". |
| root node | Core parameter. Select the progenitor cell or early developmental cell type in the cell development process, for example, Plasmablast cells. |
| Cell Type | Multiple selection, select all cell types to be included in the pseudotime analysis. |
| Split.by | Multiple selection, labels used to split different groups when plotting. Generally, select labels for groups or samples, such as Group or Sample. |
| Allow multiple disconnected trajectories | Boolean value, determines whether to allow learning disconnected trajectories in different partitions. Enabled by default, suitable for complex datasets with multiple independent developmental processes. |
| Enrichment Analysis | Boolean value, select whether to perform GO/KEGG functional enrichment analysis on identified gene modules. Enabled by default. |
| Species | Select the species corresponding to your data for gene functional enrichment analysis. Currently, the platform supports human and mouse. |
| Downsample | Boolean value, select whether to perform random downsampling on large datasets before analysis. Suitable for ultra-large datasets, can significantly improve computational speed. |
| Downsample Number | Integer, if Downsample is enabled, this parameter specifies the number of cells to sample. |
| Note | Custom remark information. |
Operation Process
- Enter the analysis module: Navigate to the "Advanced Analysis" module on the SeekSoul™ Online platform and select "monocle3" as the analysis workflow.
- Create a new task: Name your analysis task and select the samples or projects to analyze.
- Configure parameters: According to the above guidelines, select the cell types to analyze, and be sure to accurately specify the starting point of the trajectory.
- Submit the task: After confirming that the parameters are correct, click the "Submit" button and wait for the analysis to complete.
- Download and view: After the analysis is completed, download and view the generated analysis report and result files from the task list.
Result Interpretation
The Monocle3 analysis report contains rich charts and data files. Here is a detailed interpretation of the core results.
Cell Trajectory Overview
This is the core and most intuitive result of Monocle3 analysis. It overlays the learned trajectory "skeleton" and calculated pseudotime values on the UMAP dimensionality reduction plot.
Pseudotime Distribution Plot
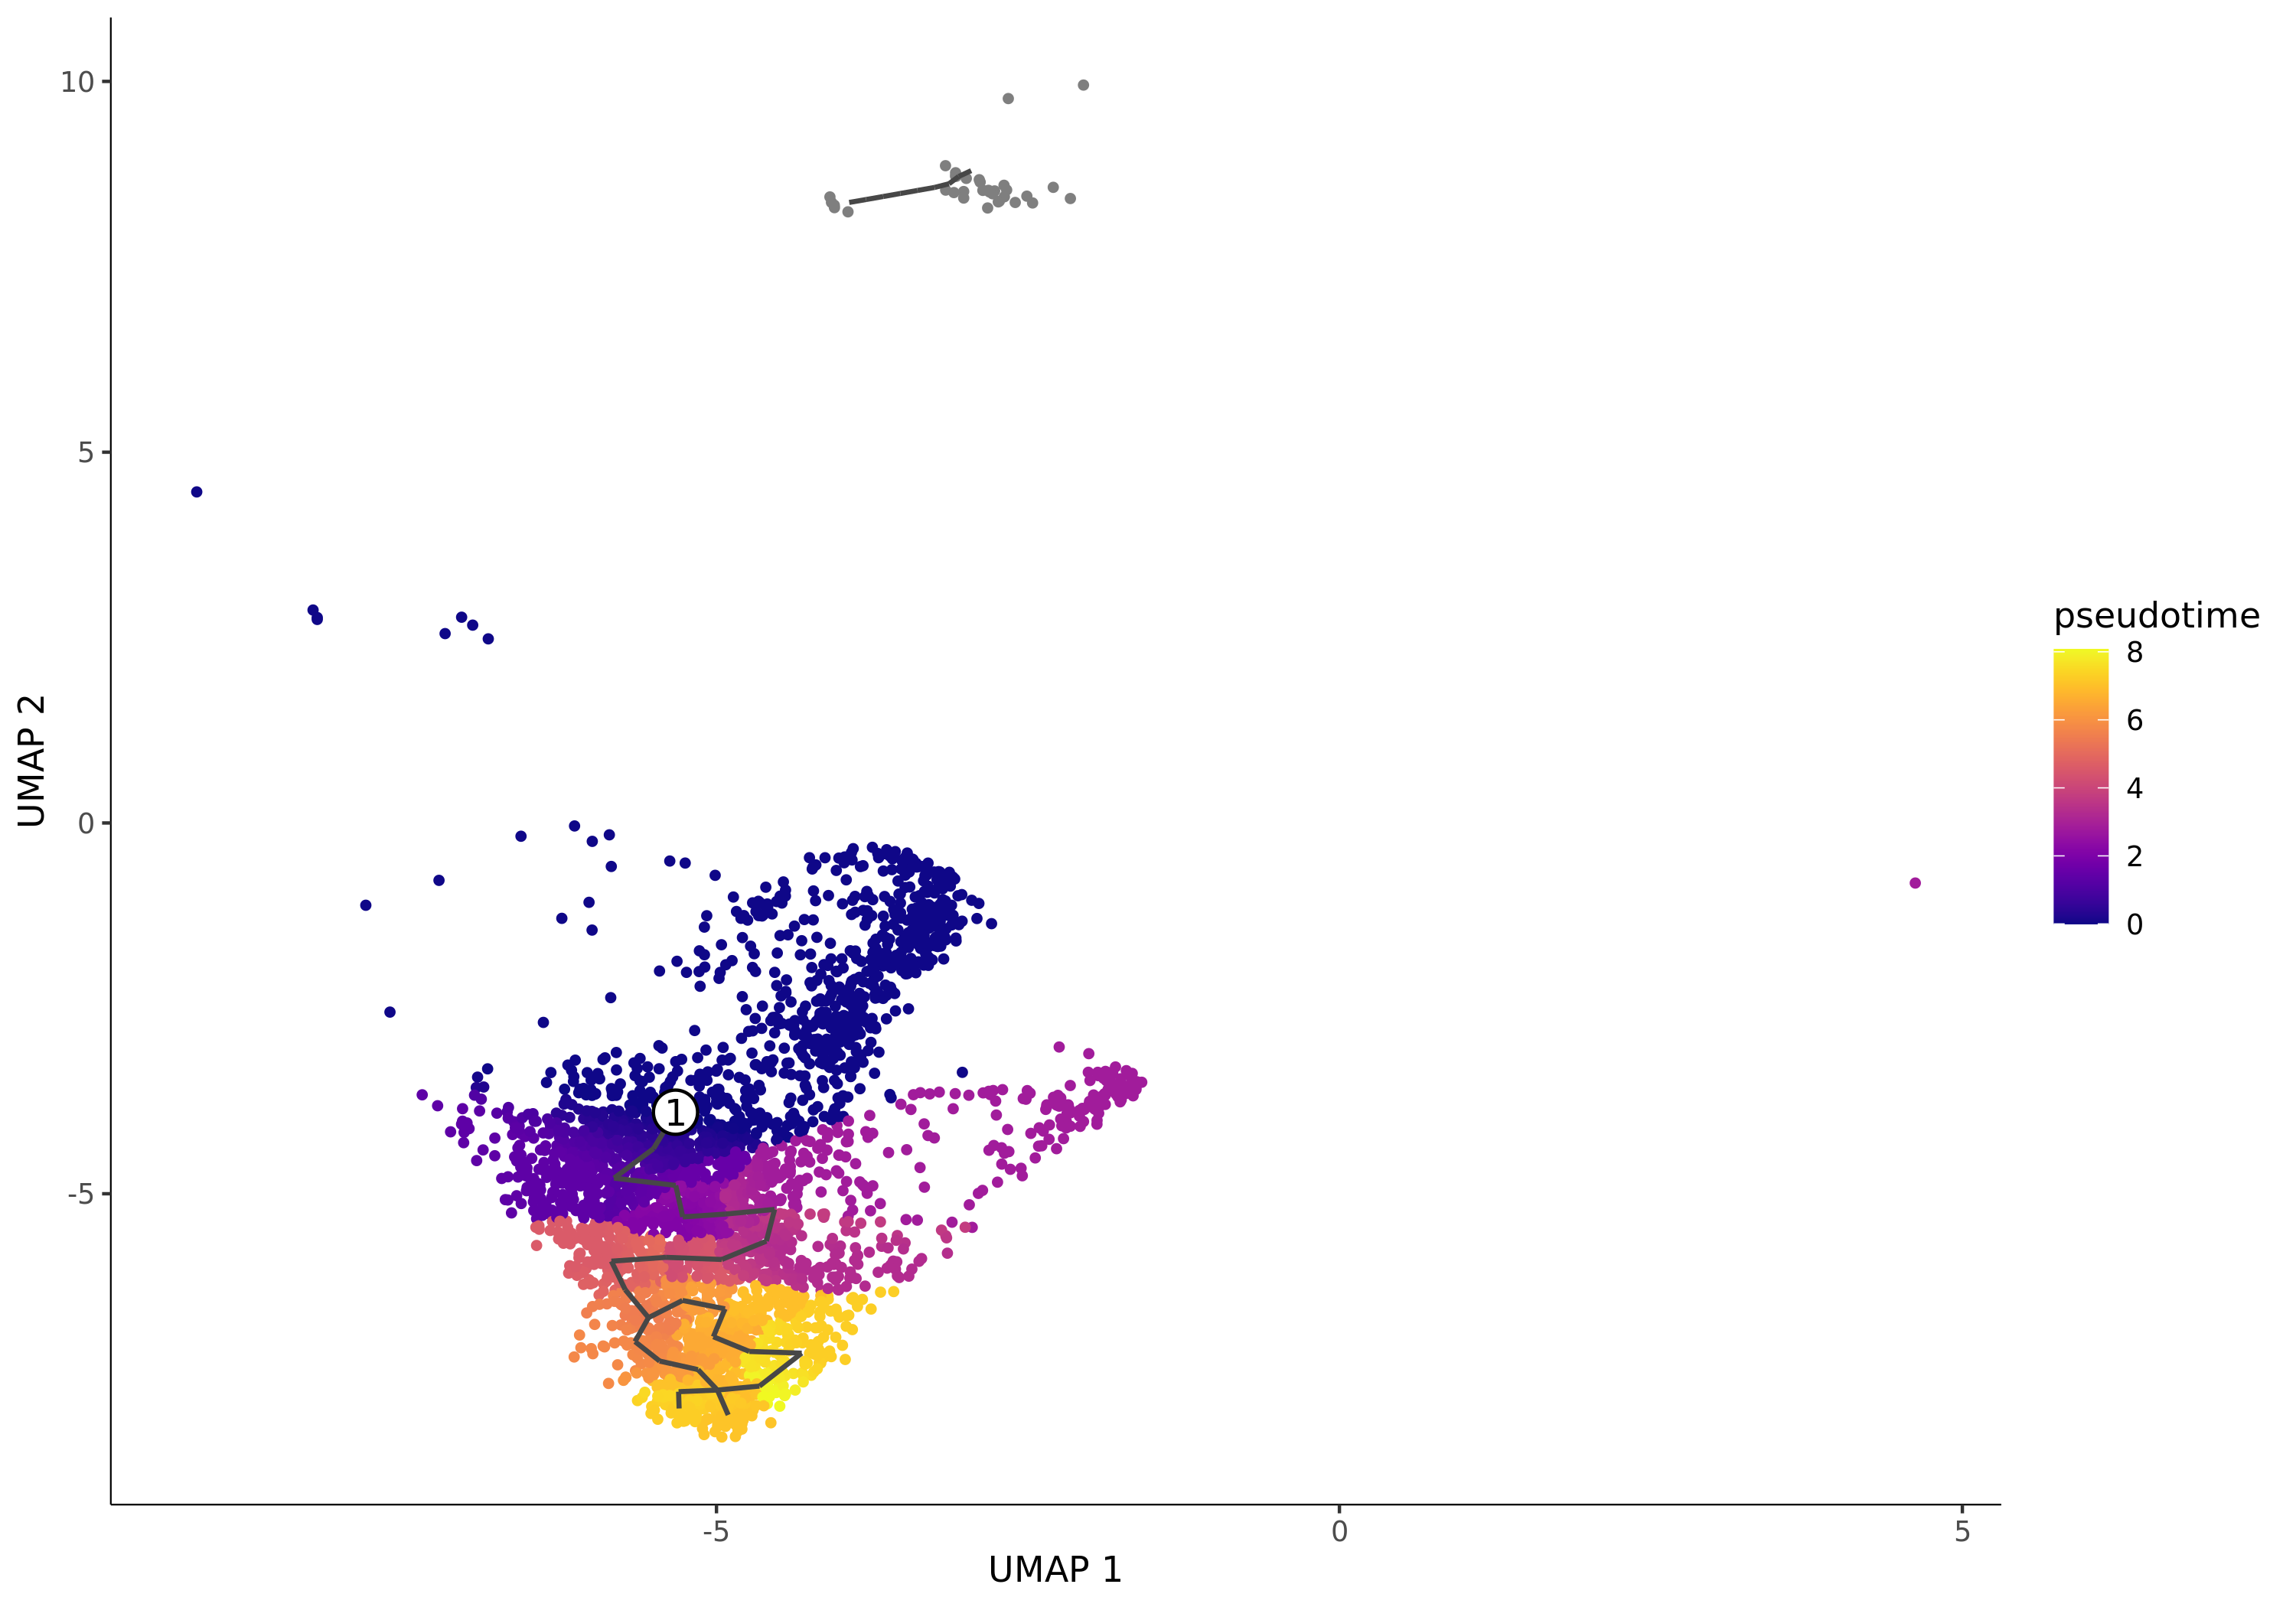
- Chart Interpretation: Each point represents a cell. The color represents the pseudotime value of the cell, usually changing from dark (early) to light (late). A smaller pseudotime value indicates the cell is closer to the specified starting point. The numbered white circles indicate the root nodes (starting points) you specified.
- Analysis Points:
- Observe the overall shape and color gradient of the trajectory to determine if the differentiation direction meets expectations.
- Note the gray points, which represent cells not in the same "partition" as the starting point. Monocle3 does not calculate pseudotime values for them.
Cell Population (Celltype) Trajectory Plot
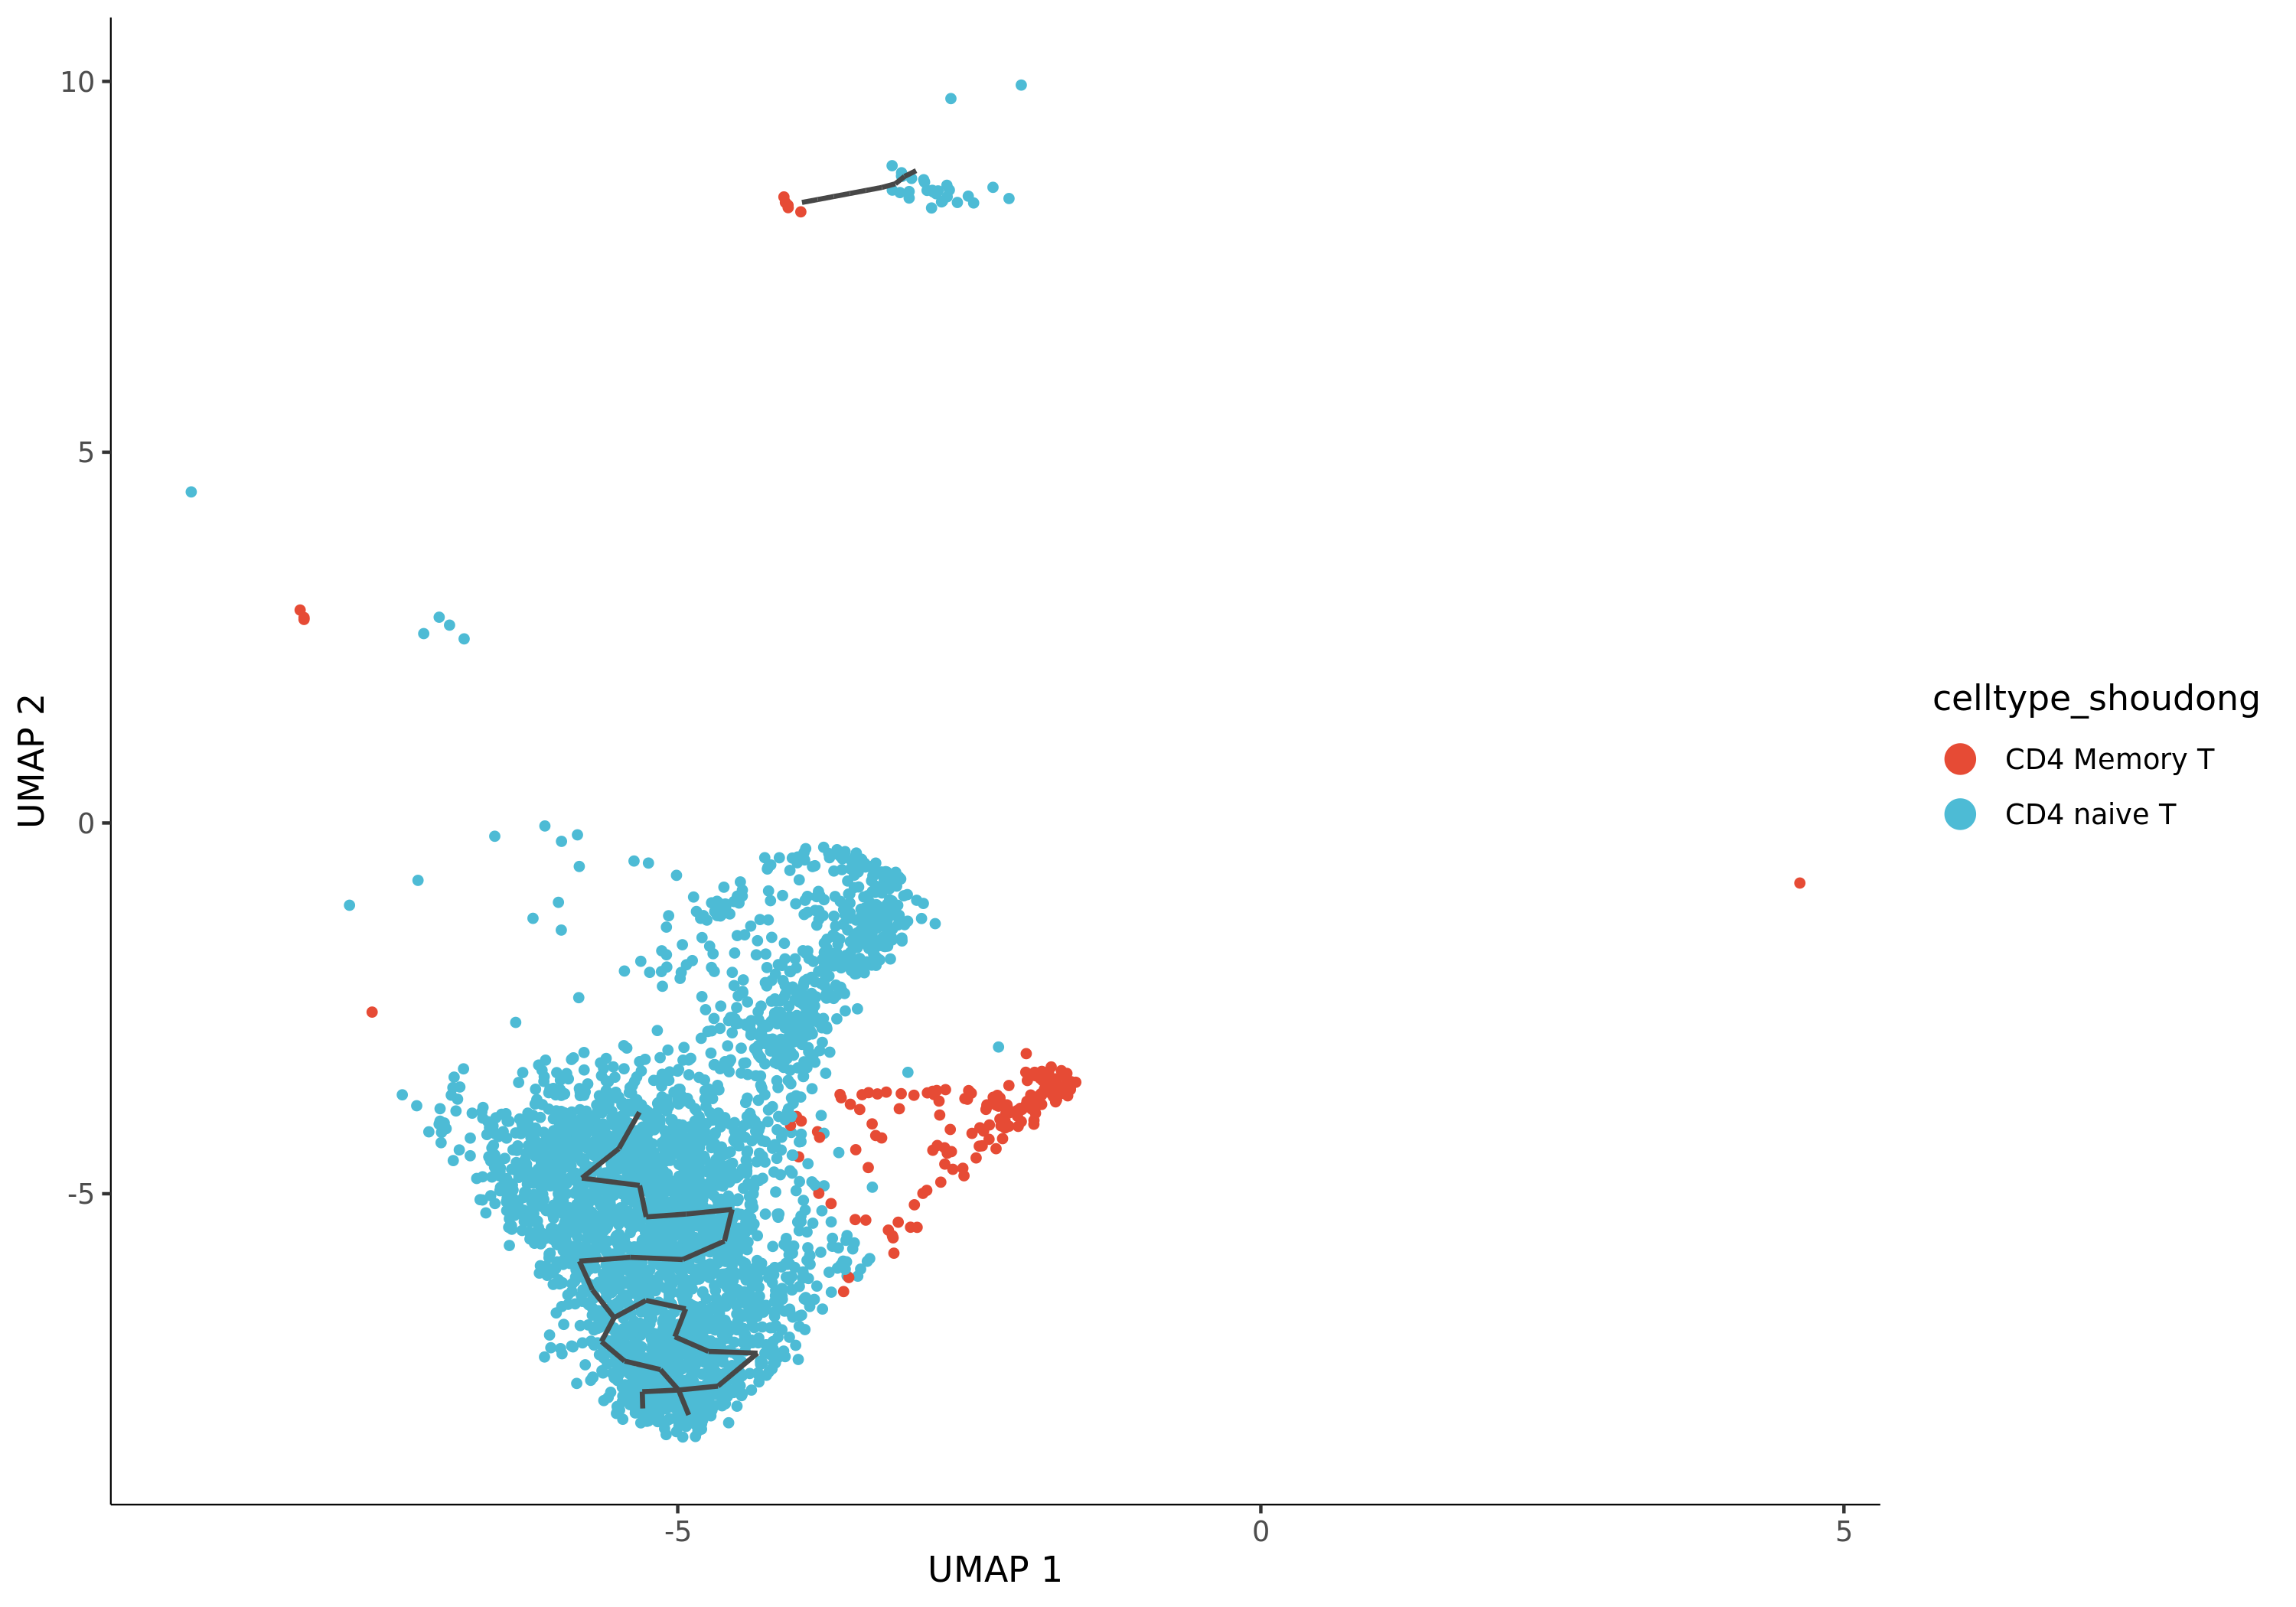
- Chart Interpretation: This is a crucial plot. It maps your pre-annotated cell types onto the trajectory, with different colors representing different cell types.
- Analysis Points:
- Verify the biological significance of the trajectory: Check if the distribution of cell types conforms to known biological processes. Is the starting cell population you specified located at the beginning of the trajectory? Are terminally differentiated cells located at the ends of the trajectory?
- Determine differentiation paths: By observing the continuous arrangement of cell types, you can infer the direction and path of differentiation.
The report also provides trajectory plots with branch points and terminal nodes (Leaves), as well as trajectory plots split by sample or group, facilitating more in-depth analysis.
Genes Changing Along the Trajectory
Monocle3 uses spatial autocorrelation analysis (Moran's I) to identify genes that exhibit significant spatial co-expression patterns in UMAP space. These genes are likely key genes that dynamically change along the trajectory.
Core Gene Expression Trend Plot
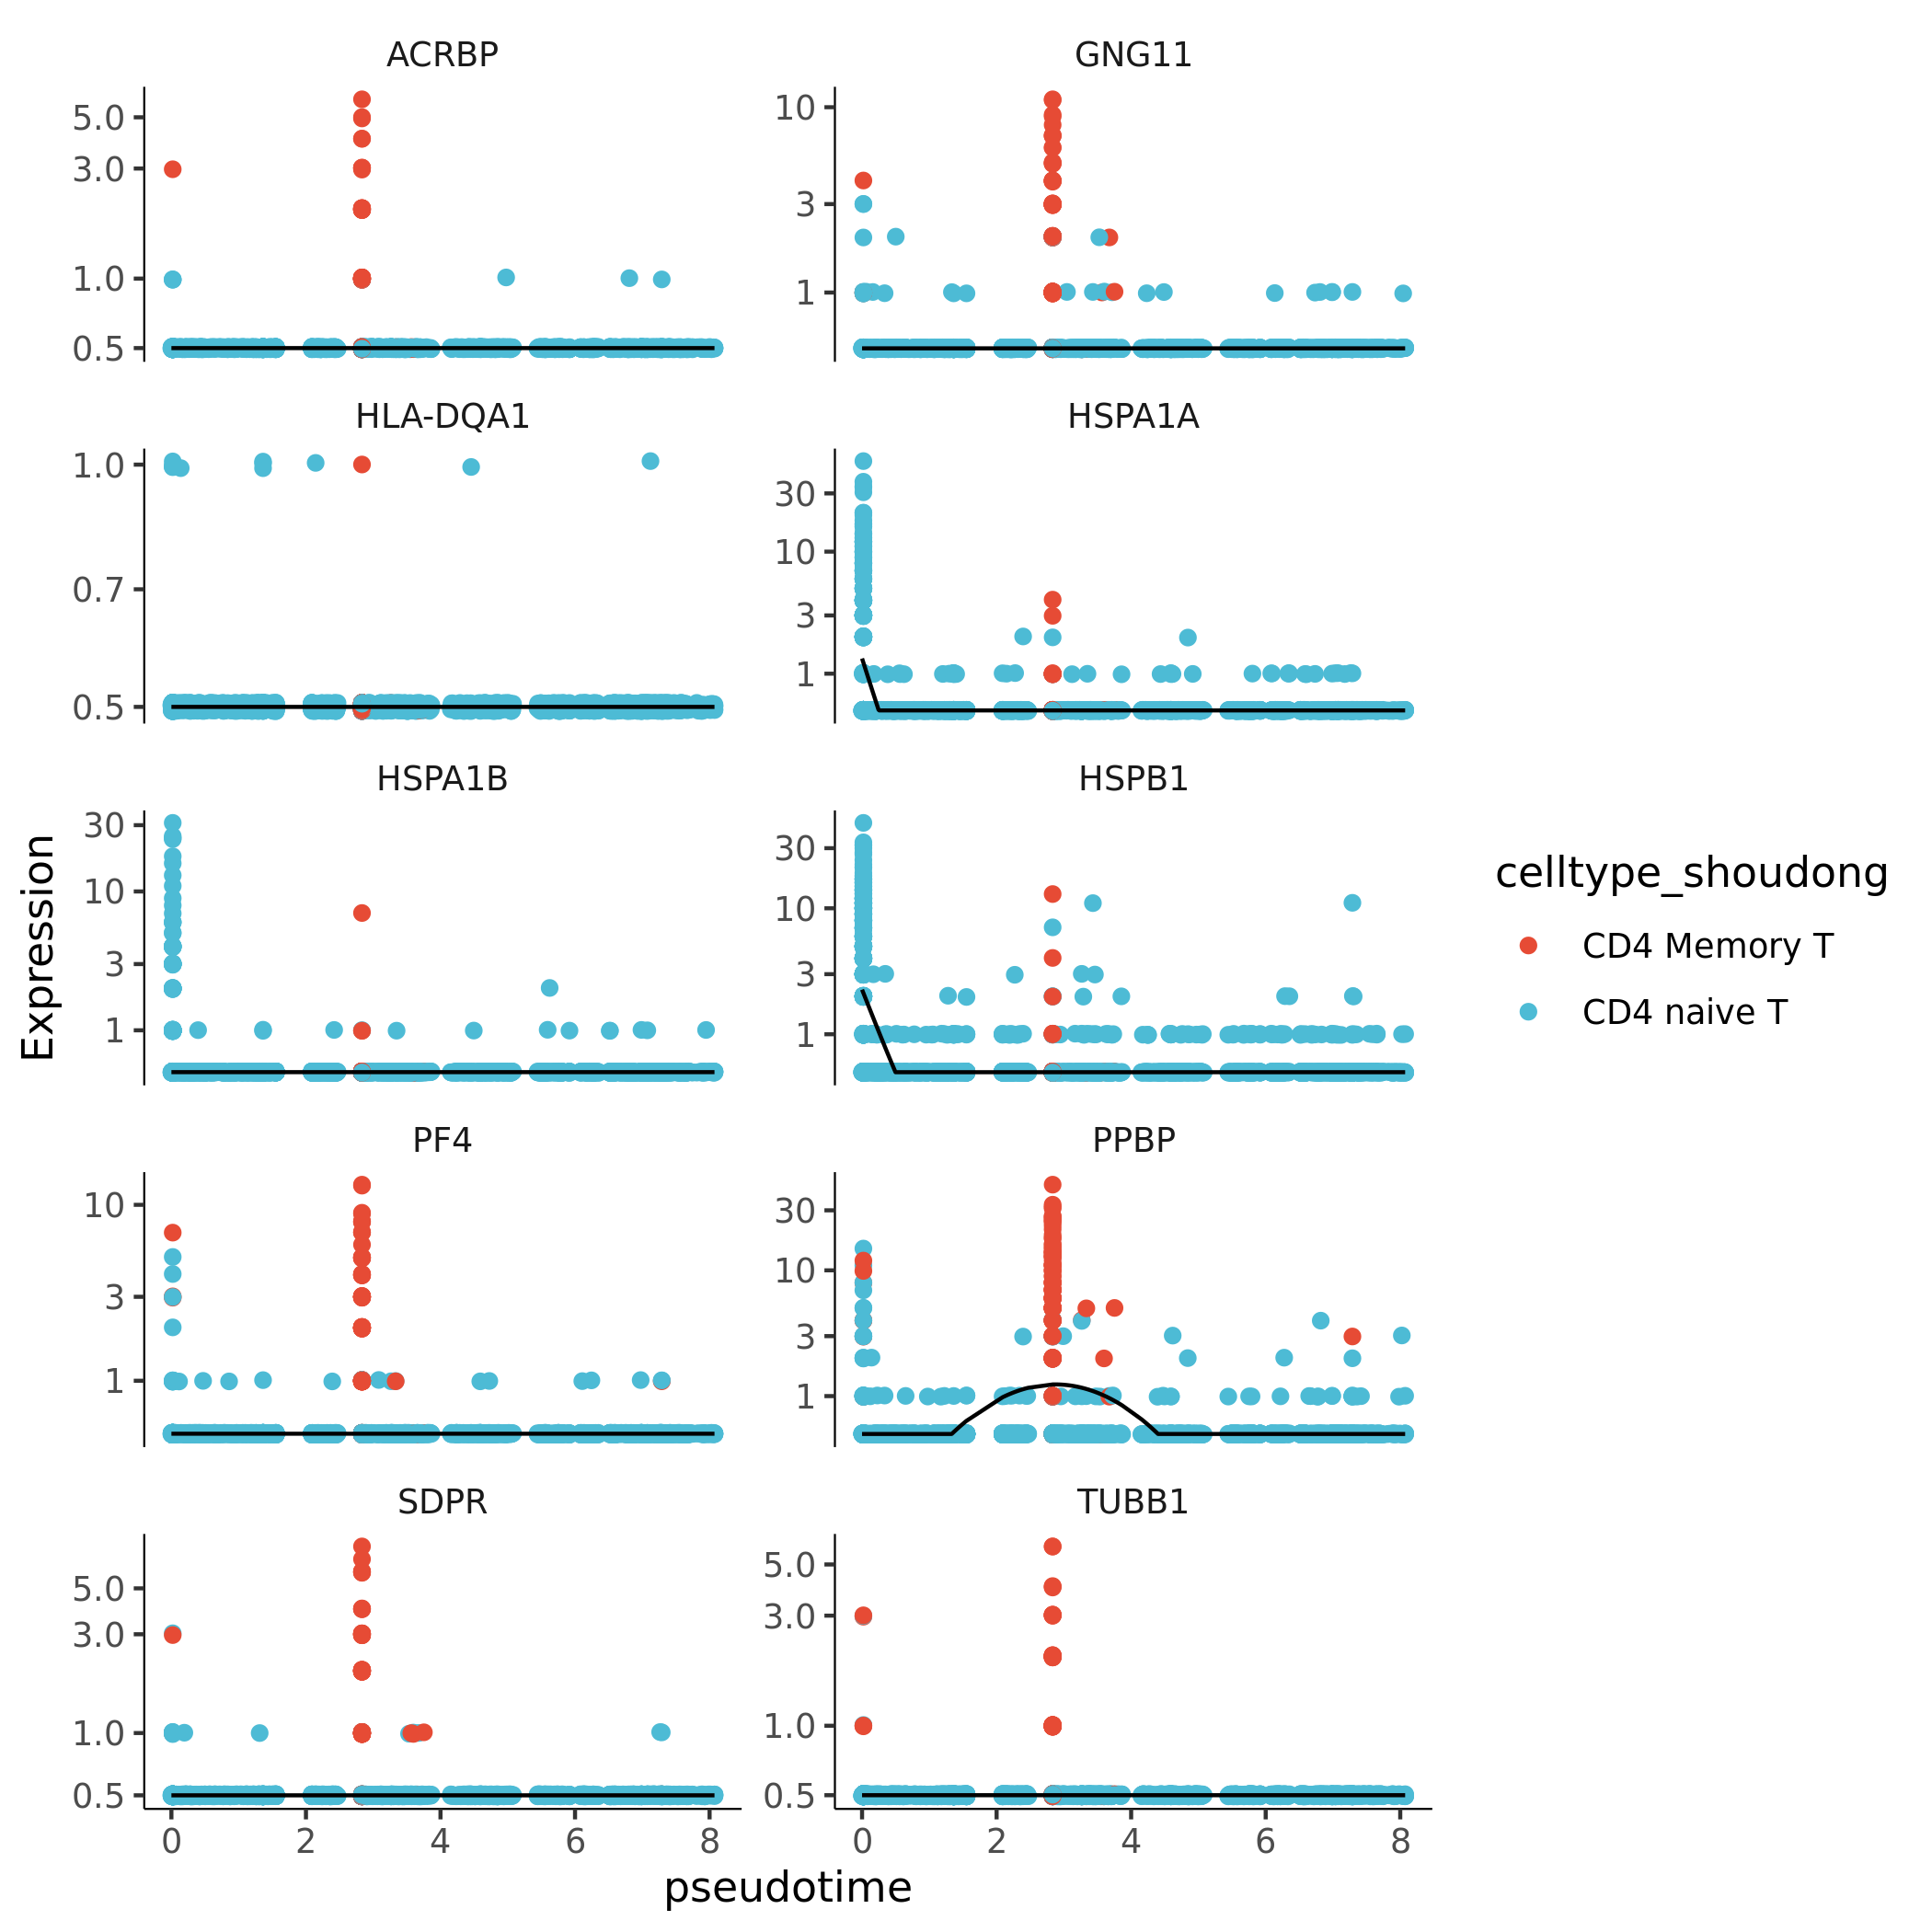
- Chart Interpretation: This plot shows how the expression levels of a group of genes with the highest Moran's I index (Top10) change with pseudotime.
- X-axis: Pseudotime.
- Y-axis: Normalized gene expression level.
- Each point: Represents a cell.
- Curve: Fitted gene expression trend.
- Analysis Points:
- Identify different gene expression patterns, such as genes highly expressed in early development and downregulated in late stages, or genes gradually upregulated in late development.
Co-regulated Gene Module Analysis
To better understand gene functions, Monocle3 clusters genes with similar expression trends into "gene modules."
Gene Module Expression Heatmap
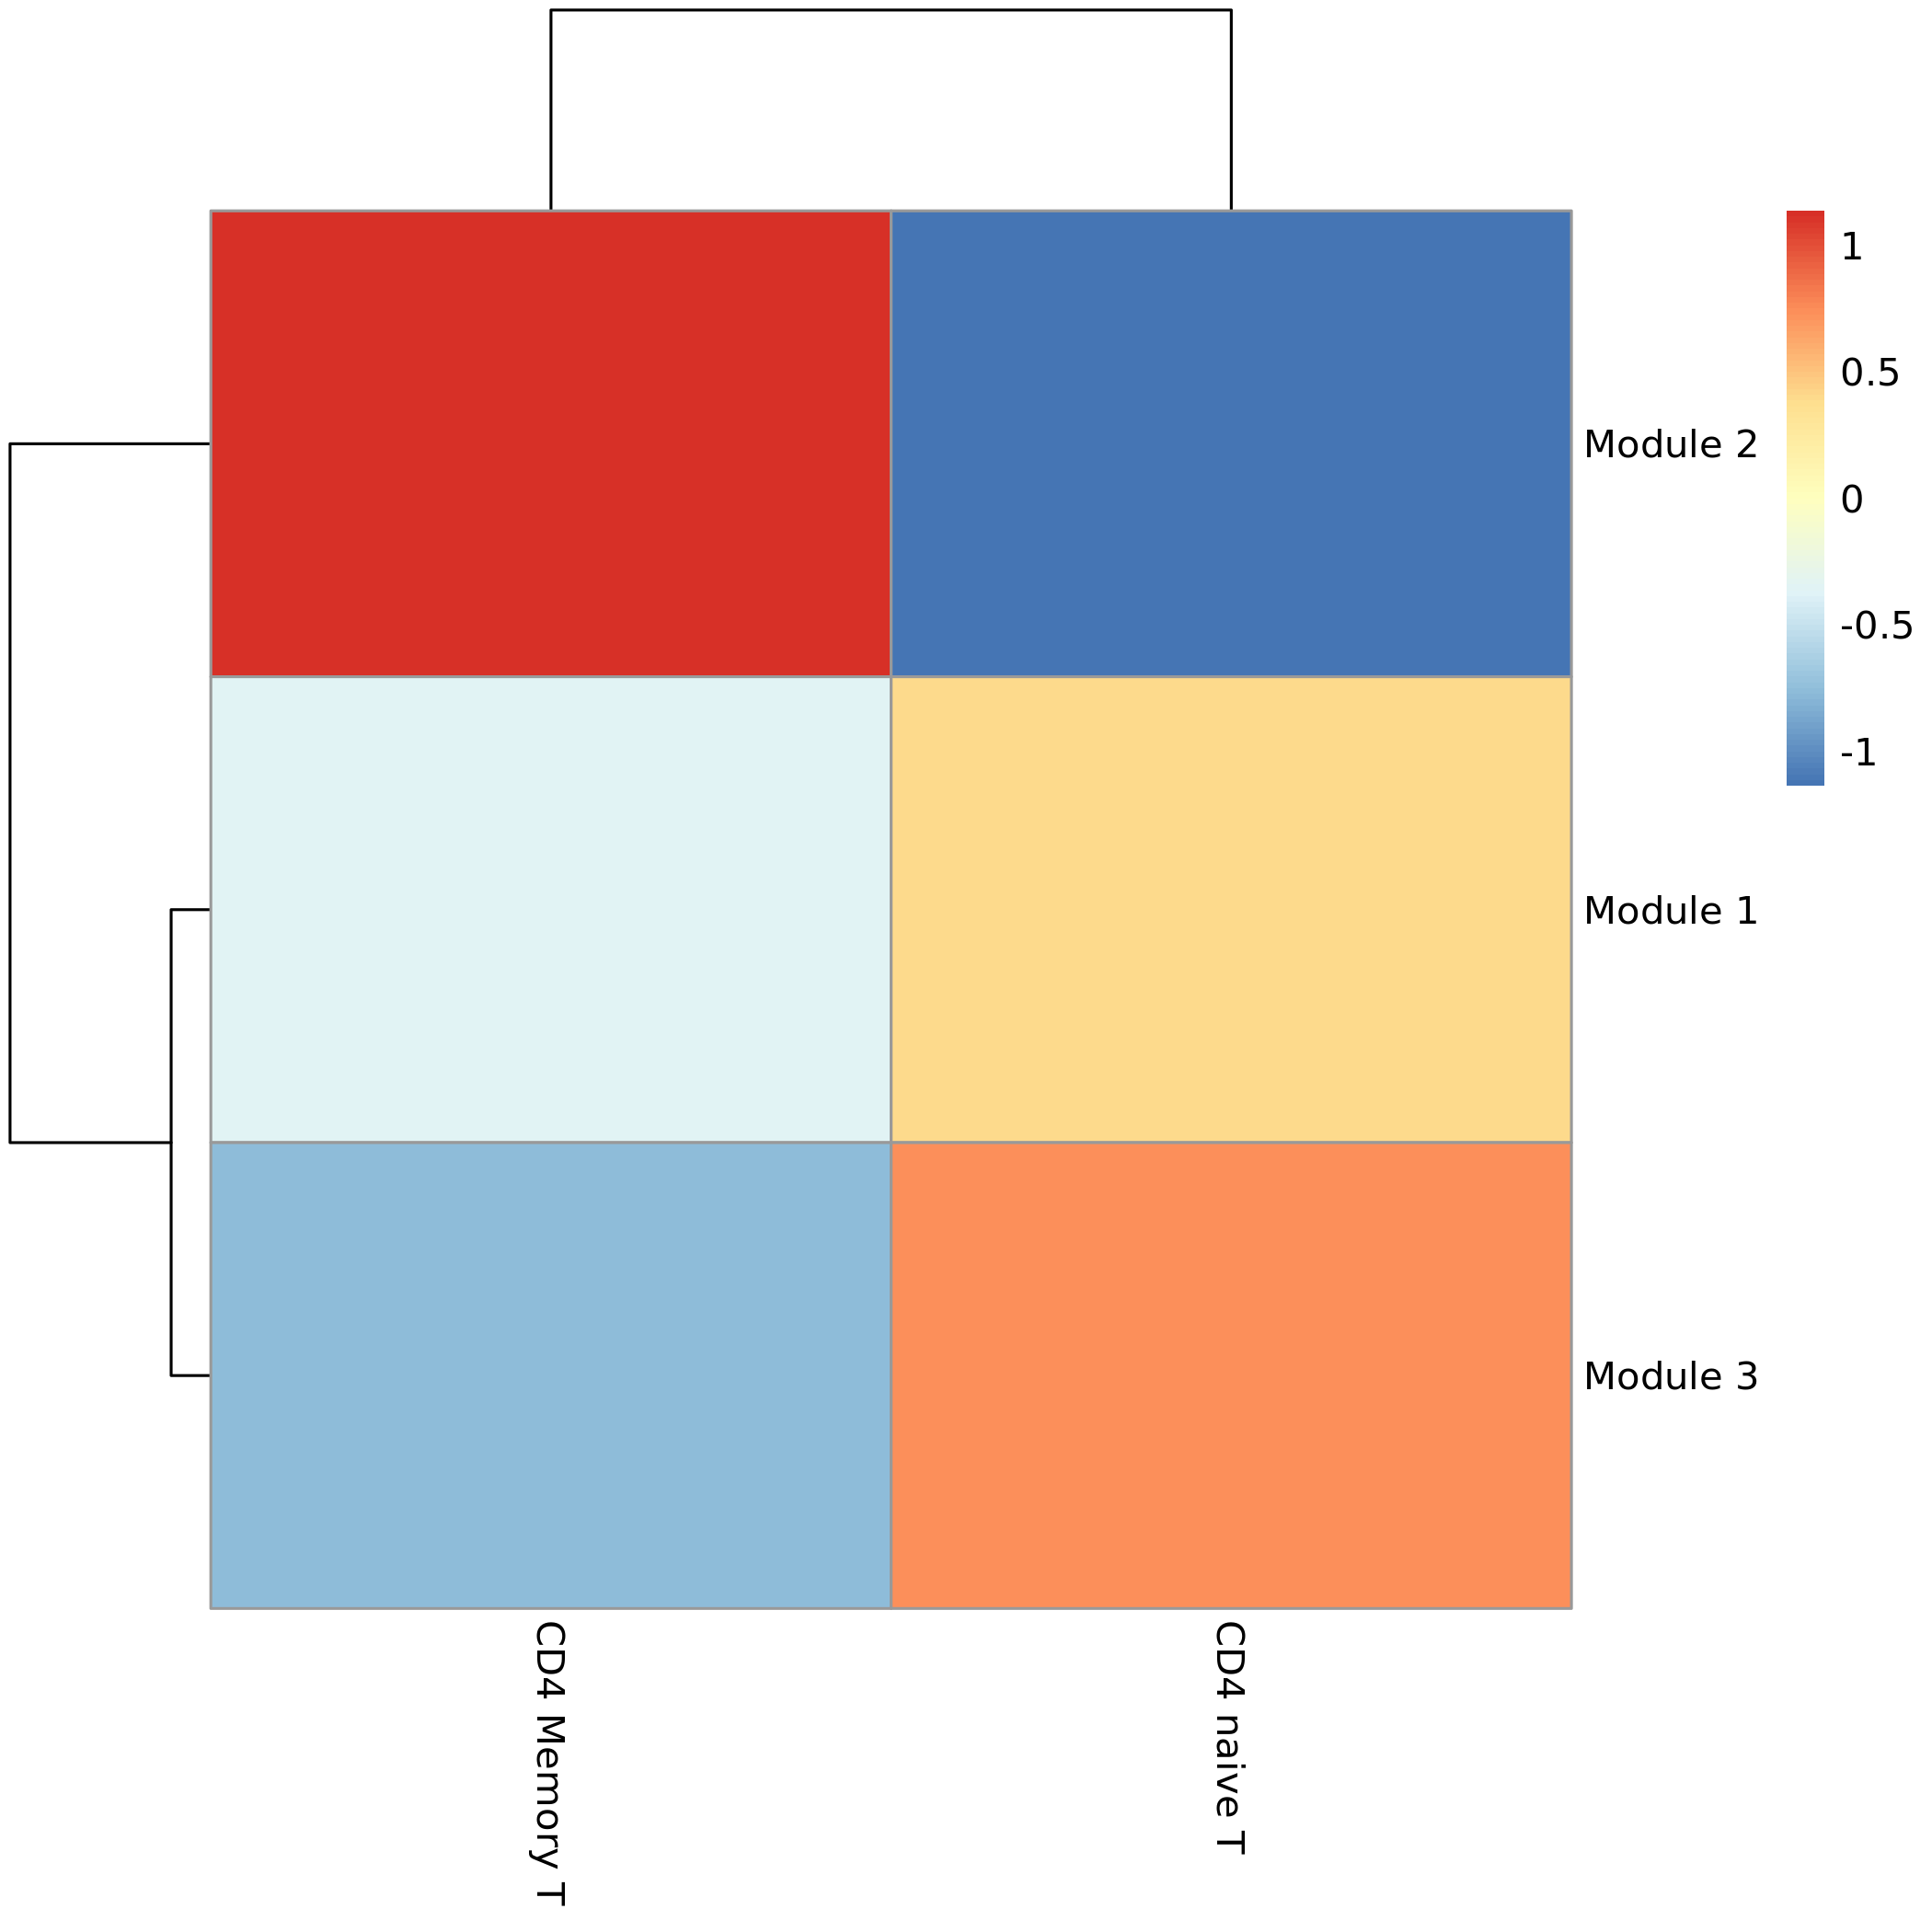
- Chart Interpretation: The heatmap shows the average expression level of different gene modules in different cell types.
- X-axis: Cell types (arranged by trajectory order or clustering relationship).
- Y-axis: Gene modules.
- Color: Red indicates high overall expression of the module in that cell type, blue indicates low expression.
- Analysis Points:
- Associate specific gene modules with specific cell types or developmental stages. For example, a module may be highly expressed only in stem cells at the beginning of the trajectory, while another module is highly expressed in multiple terminally differentiated cells.
Functional Enrichment Analysis of Gene Modules
GO and KEGG functional enrichment analyses of each gene module can reveal changes in biological functions at different developmental stages.
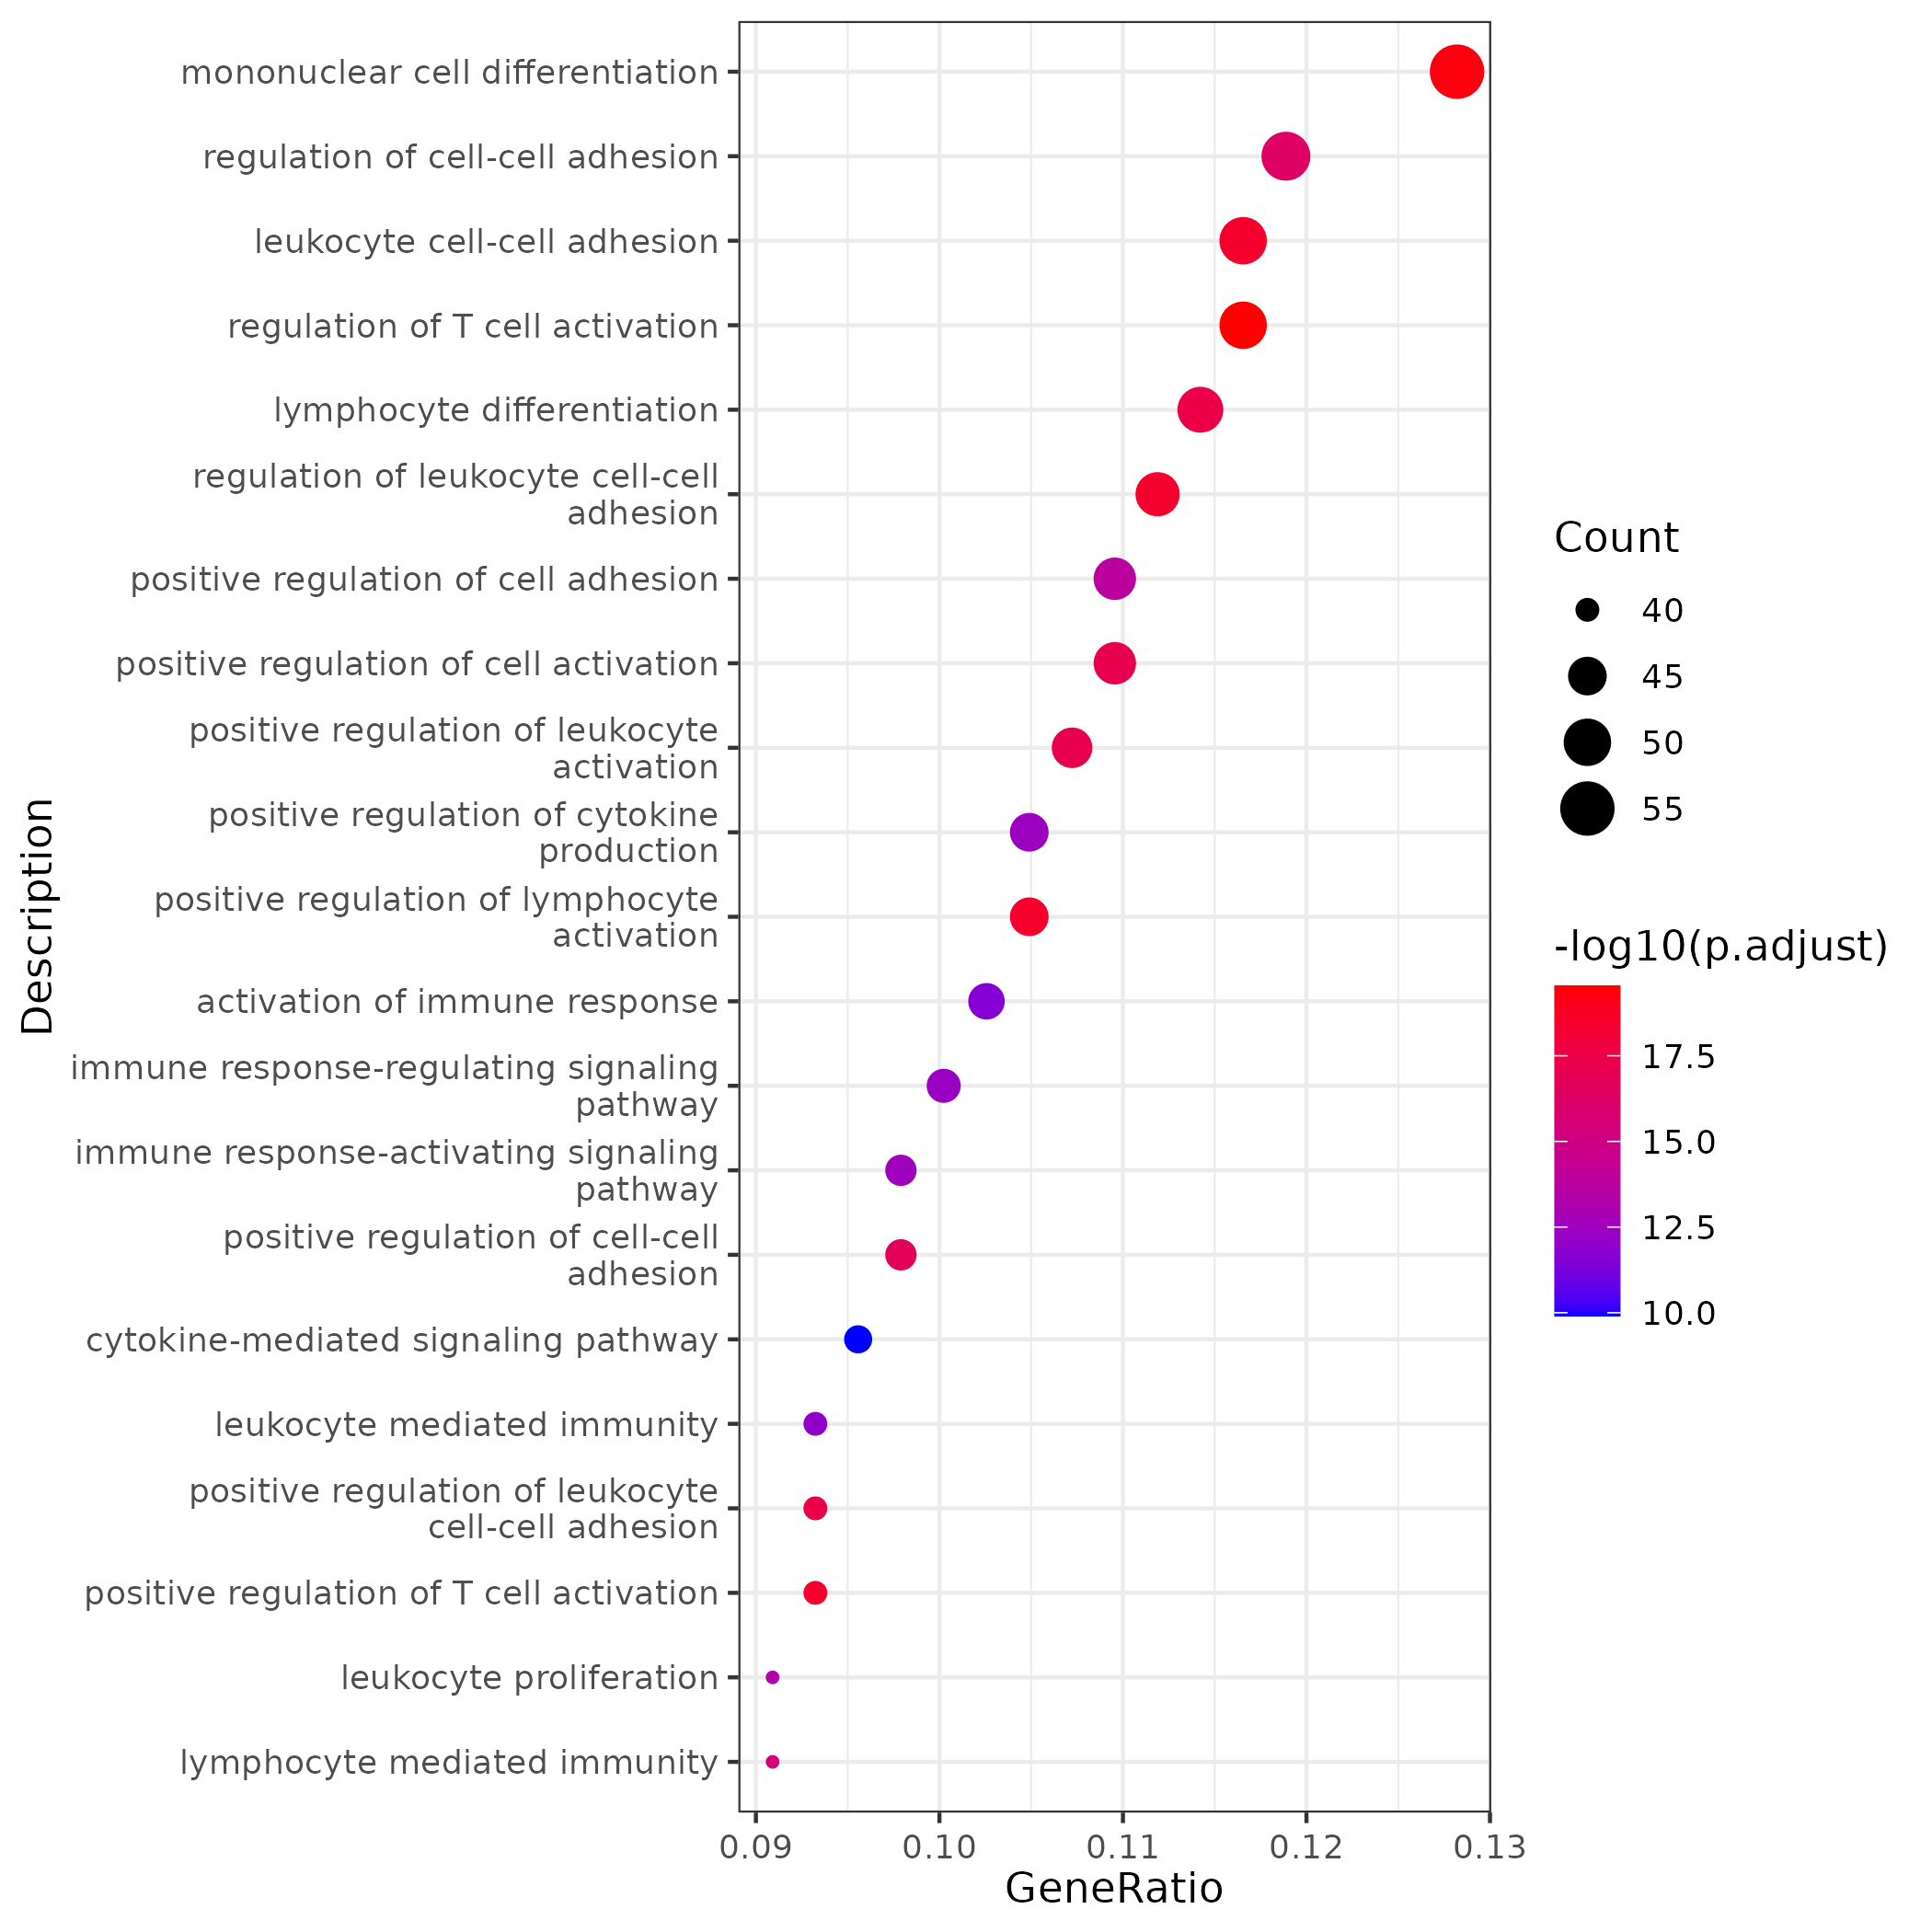
- Chart Interpretation: The bubble plot shows the biological pathways significantly enriched in a gene module.
- X-axis: GeneRatio, representing the proportion of genes in the pathway to the total genes in the module.
- Y-axis: Names of enriched pathways.
- Color: Represents the significance of enrichment (p.adjust), with red indicating higher significance.
- Point size: Represents the number of genes enriched in the pathway.
- Analysis Points:
- Assign biological functions to each gene module. For example, modules related to stem cells may be enriched in "cell cycle" pathways, while modules related to differentiated cells may be enriched in pathways related to their specific functions.
List of Result Files
| Directory/File Name | Description |
|---|---|
trajectory/ | Core results directory for trajectory analysis |
*_pseudotime.png/pdf | Distribution of pseudotime values on UMAP. |
*_trajectory.png/pdf | Trajectory plot overlaying cell types. |
*_genetop10.png/pdf | Expression trend plot of Top10 dynamically changing genes with pseudotime. |
gene_module/ | Results directory for gene module analysis |
*_gene_module.xls | List of modules to which each gene belongs. |
*_gene_module_heatmap.png/pdf | Expression heatmap of gene modules in different cell populations. |
enrichment/ | Results directory for functional enrichment analysis |
go/*_module_go.xls | GO enrichment analysis results for all modules. |
kegg/*_module_kegg.xls | KEGG enrichment analysis results for all modules. |
go/*_barplot.png/pdf | Bar charts of GO enrichment results for each module. |
go/*_dotplot.png/pdf | Bubble plots of GO enrichment results for each module. |
Application Cases
Case: Resolving Cell State Transitions in Pancreatic Cancer
- Literature: Cui Zhou D, et al. Nat Genet. 2022.
- Background: Researchers wanted to understand how normal acinar cells transform into ductal cells or tumor cells during pancreatic cancer development.
- Analysis Strategy: Perform Monocle3 pseudotime analysis on cells from pancreatic cancer samples, specifying acinar cells as the starting point of the trajectory.
- Key Findings:
- Constructed two different differentiation paths originating from acinar cells.
- One path leads to the normal ductal cell state, with ADM_Normal cells as an intermediate transition state.
- The other path leads to precancerous lesion cells (PanIN), with ADM_Tumor cells as an intermediate transition state.
- The analysis clearly revealed two parallel cell evolution paths mediated by different intermediate states that may exist during pancreatic cancer development.
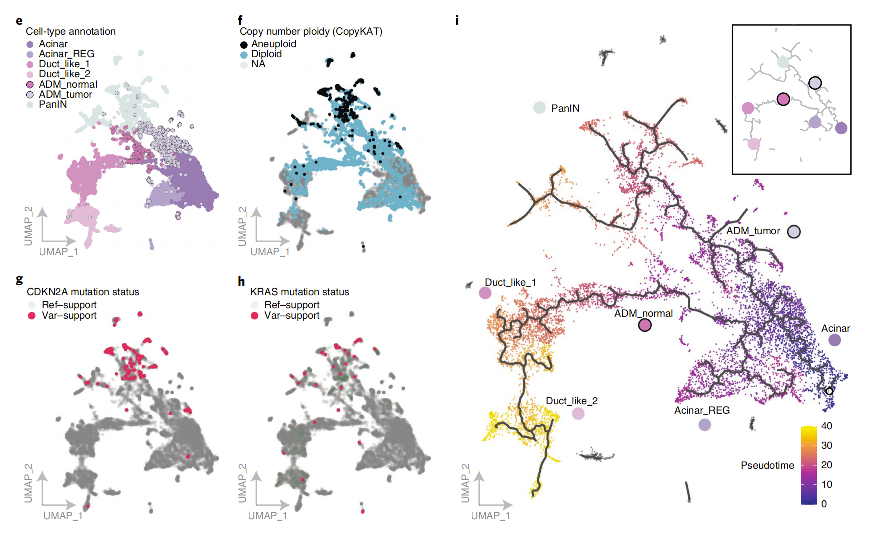
(Figure Note: Monocle3 pseudotime analysis reveals independent transition paths from acinar cells to ADM_Tumor and ADM_Normal states.)
Precautions
1. Avoid overinterpretation: Pseudotime trajectories are computational inferences based on transcriptomic data and do not equal real cell lineages. Any key findings need to be confirmed by subsequent biological experiments (such as lineage tracing, functional validation).
2. Root node selection is crucial: Monocle3 results completely depend on the user-specified root node. Incorrectly specifying the root node will result in incorrect trajectory direction and conclusions. Be sure to select the starting cell population based on sufficient biological prior knowledge.
3. Focus on gene modules: Compared to individual genes, gene modules can more robustly reflect biological functions. Focus on analyzing gene modules related to key cell states or trajectory branches, and conduct in-depth functional enrichment analyses on them.
4. Results are not static: Trajectory construction is affected by upstream dimension reduction and clustering. If the trajectory results do not meet expectations, you can try adjusting UMAP parameters or clustering resolution, which may improve the trajectory morphology.
Frequently Asked Questions (FAQ)
Q1: How should I choose between Monocle3 and Monocle2?
A:
- Choose Monocle3: When your dataset is very large (>100,000 cells), or you expect multiple independent, disconnected differentiation processes. The speed and scalability of Monocle3 are its greatest advantages.
- Choose Monocle2: When your dataset is moderately sized, and you expect a relatively continuous, clearly branching tree-like differentiation process. Monocle2's DDRTree algorithm is classic and powerful in constructing clear "tree" structures.
Q2: How should I choose the starting point (Root cells) of the trajectory?
A: This is the most critical question. Please follow these principles:
- Utilize prior knowledge: Based on your experimental design and biological background, select the most "primitive" cell type. For example, choose stem cells/progenitor cells in developmental research; choose cells before treatment (control group) in drug stimulation experiments.
- Use auxiliary tools: Tools like CytoTRACE can be used to predict cell differentiation potential. Cell populations with the highest scores are usually good starting point candidates.
- Try different starting points: If unsure, you can try selecting different cell populations as starting points and compare which results better align with known biological facts.
Q3: Why are some cells in my plot gray and without pseudotime values?
A: This is because Monocle3 first divides cells into disconnected "partitions." Only cells in the same partition as the specified root node will have pseudotime calculated. Gray cells are in other partitions, and the algorithm considers them unrelated to the trajectory you care about. This is usually normal but also suggests there may be multiple independent biological processes in your data.
Q4: What's the difference between Moran's I and differential expression analysis in Monocle2?
A:
- Monocle2 looks for genes that change significantly with pseudotime values, focusing on the functional relationship between gene expression and "time."
- Monocle3's Moran's I looks for genes that show significant spatial co-expression patterns in UMAP space, focusing on the correlation between gene expression and "spatial position." Since UMAP space itself reflects cell similarity relationships, spatially co-expressed genes are usually dynamically changing along trajectories, but the mathematical principles are different.
Q5: My trajectory plot looks messy or not as expected. What should I do?
A:
- Check upstream analysis: The quality of trajectories heavily depends on upstream UMAP dimensionality reduction. Try adjusting UMAP parameters or clustering resolution to generate a UMAP plot with a more reasonable cell type distribution, then re-run Monocle3.
- Check root node selection: Confirm whether your root node selection is correct.
- Check cell population selection: Ensure that the cell populations you include in the analysis truly have continuous transition relationships.
Q6: What are the differences and connections between Monocle3, CytoTRACE, and scVelo? How should I use them in combination?
A: These three tools address core issues of cell dynamic processes from different dimensions. Combining their use can construct more complete and credible biological stories.
| Tool | Core Question | Principle | Advantages | Disadvantages |
|---|---|---|---|---|
| Monocle3 | What is the path? | Reconstructs trajectories by learning the principal graph based on cell arrangement in low-dimensional space (UMAP). | Excels at handling large-scale, multi-branched, and even disconnected complex trajectories. | Results depend on dimensionality reduction quality and must be manually specified root node; does not provide directionality itself. |
| CytoTRACE | Where is the start? | Predicts cell differentiation potential based on the hypothesis that "the number of expressed genes is inversely proportional to cell differentiation potential." | Provides an objective, unbiased method to identify the starting cell population of trajectories; it is the gold standard for verifying Monocle3 starting point selection. | Only predicts differentiation potential, does not provide trajectory paths or directions. |
| scVelo | What is the direction & speed? | Infers the future transcriptional state of each cell through RNA velocity (spliced/unspliced RNA ratio) models. | Can reveal the instantaneous direction and rate of cell state transitions, giving "vector" information to static trajectory plots; can distinguish between cyclic processes and terminal differentiation. | Has high data quality requirements (needs UMI counts); results may be affected by model assumptions; complex calculations. |
Summary and recommended workflow:
- Predict the starting point (CytoTRACE): First run CytoTRACE to find the cell population with the highest differentiation potential (highest score) on the UMAP plot.
- Construct trajectories (Monocle3): Run Monocle3, using the starting point predicted by CytoTRACE as the "Root Node" parameter to construct the main path of cell differentiation.
- Infer direction (scVelo): Overlay scVelo's RNA velocity vector flow on the UMAP plot to dynamically verify the directionality of Monocle3 trajectories and reveal finer cell state transition dynamics.
Through this "three-step process," you can construct a logically rigorous and evidence-complementary story of cell dynamic changes from "determining the starting point" to "depicting the path" and then "inferring the direction."
References
- Cao, J., et al. (2019). The single-cell transcriptional landscape of mammalian organogenesis. Nature, 566(7745), 496-502.
- Cui Zhou, D., et al. (2022). Spatially restricted drivers and transitional cell populations cooperate with the microenvironment in untreated and chemo-resistant pancreatic cancer. Nature Genetics, 54(9), 1390-1405.
- Trapnell, C., et al. (2014). The dynamics and regulators of cell fate decisions are revealed by pseudo-temporal ordering of single cells. Nature biotechnology, 32(4), 381-386.